Simplifying CloudWatch Alarms with AWS CDK L2 Constructs

Manoj Kengudelu
Author

When building serverless applications, monitoring is crucial. A misconfigured permission or an unexpected error can break your application, and without proper alerting, you might not know about it until your users complain. In this article, I'll show you how AWS CDK's L2 constructs make it remarkably simple to set up CloudWatch alarms for your Lambda functions.
The Problem: Silent Failures
Imagine you've built a serverless backend using AWS Lambda to list items from a DynamoDB table. Everything works fine during development, but then you deploy to production and forget to grant the Lambda function permission to read from DynamoDB. Your function fails silently, returning internal server errors to users.
This is exactly the scenario we'll address by creating a CloudWatch alarm that triggers whenever our Lambda function encounters an error.
Why L2 Constructs Make This Easy
AWS CDK's L2 (Level 2) constructs provide high-level abstractions that include helpful methods for common tasks. Instead of manually configuring CloudWatch metrics and alarms with complex JSON configurations, L2 constructs give you intuitive methods that handle the heavy lifting.
Understanding Metric Methods
When you create a Lambda function using CDK's Function construct, it comes with built-in metric methods. Navigate to the Python reference documentation for the aws_lambda.Function construct, and you'll find several methods starting with metric:
The Generic Metric Method: Returns any metric by name, allowing you to specify details like color, label, period, and statistic. Convenience Methods: Pre-configured methods for common metrics:
metric_duration: Tracks how long function executions take (average over 5 minutes)metric_errors: Counts failed invocations (sum over 5 minutes)metric_invocations: Tracks total function callsmetric_throttles: Monitors throttled requests
For our use case, metric_errors is perfect. It tracks Lambda function failures, which is exactly what we want to monitor.
Important Note About Statistics
By default, most CDK metric objects use "Average" as the statistic. However, for error tracking, we want to use "Sum" because each error counts individually. We'll override this default using the Stats enumeration class from the aws_cloudwatch package.
Creating the Alarm
Here's the beauty of L2 constructs: the Metric class provides a create_alarm method. This means you can chain metric creation with alarm configuration in a clean, readable way.
Let's look at the code:
from aws_cdk import (
    aws_cloudwatch as cloudwatch,
    Duration,
)

# Create the errors metric
errors_metric = product_list_function.metric_errors(
    label="ProductListFunction Errors",
    period=Duration.minutes(5),
    statistic=cloudwatch.Stats.SUM
)

# Create an alarm from the metric
errors_metric.create_alarm(
    self,
    "ProductListErrorsAlarm",
    evaluation_periods=1,
    threshold=1,
    comparison_operator=cloudwatch.ComparisonOperator.GREATER_THAN_OR_EQUAL_TO_THRESHOLD,
    treat_missing_data=cloudwatch.TreatMissingData.IGNORE
)
Breaking Down the Configuration
Metric Configuration:
label: Display name for graphs and dashboardsperiod: Time window for aggregation (5 minutes)statistic: How to aggregate data (SUM for counting errors) Alarm Configuration:evaluation_periods: How many periods to evaluate (1 means check the last 5 minutes)threshold: The value that triggers the alarm (1 error is enough)comparison_operator: How to compare metric data to threshold (greater than or equal)treat_missing_data: What to do when there's no data (IGNORE prevents false alarms)
This configuration means: "Trigger an alarm if at least one error occurs within any 5-minute period."
Testing the Alarm
To test our alarm, we can simulate a failure by commenting out the DynamoDB permission in our Lambda function configuration. After deploying this change with cdk deploy, accessing the function URL returns an internal server error.
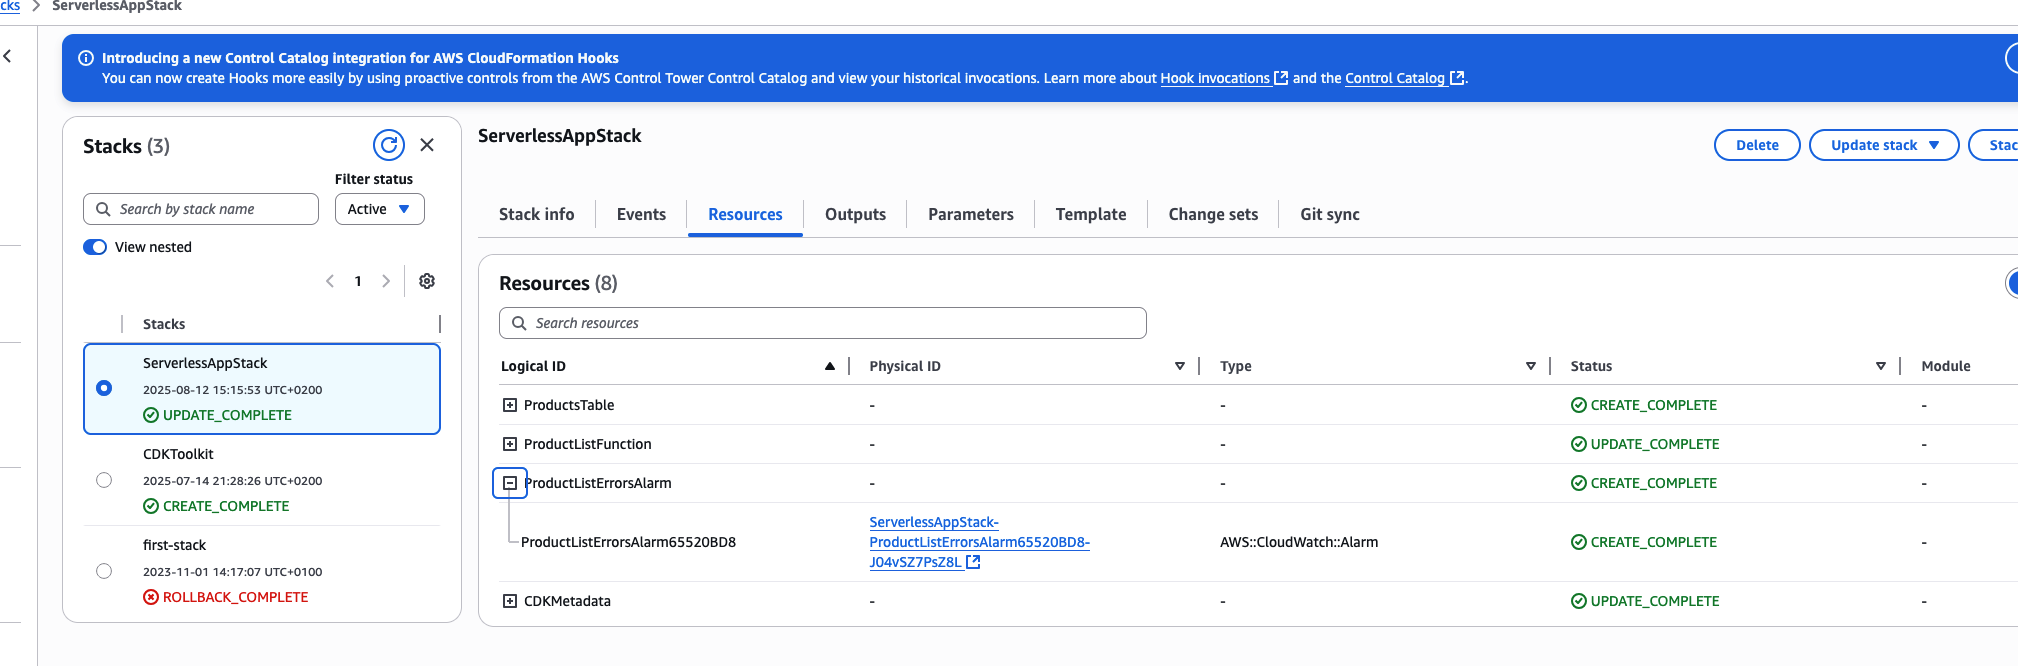
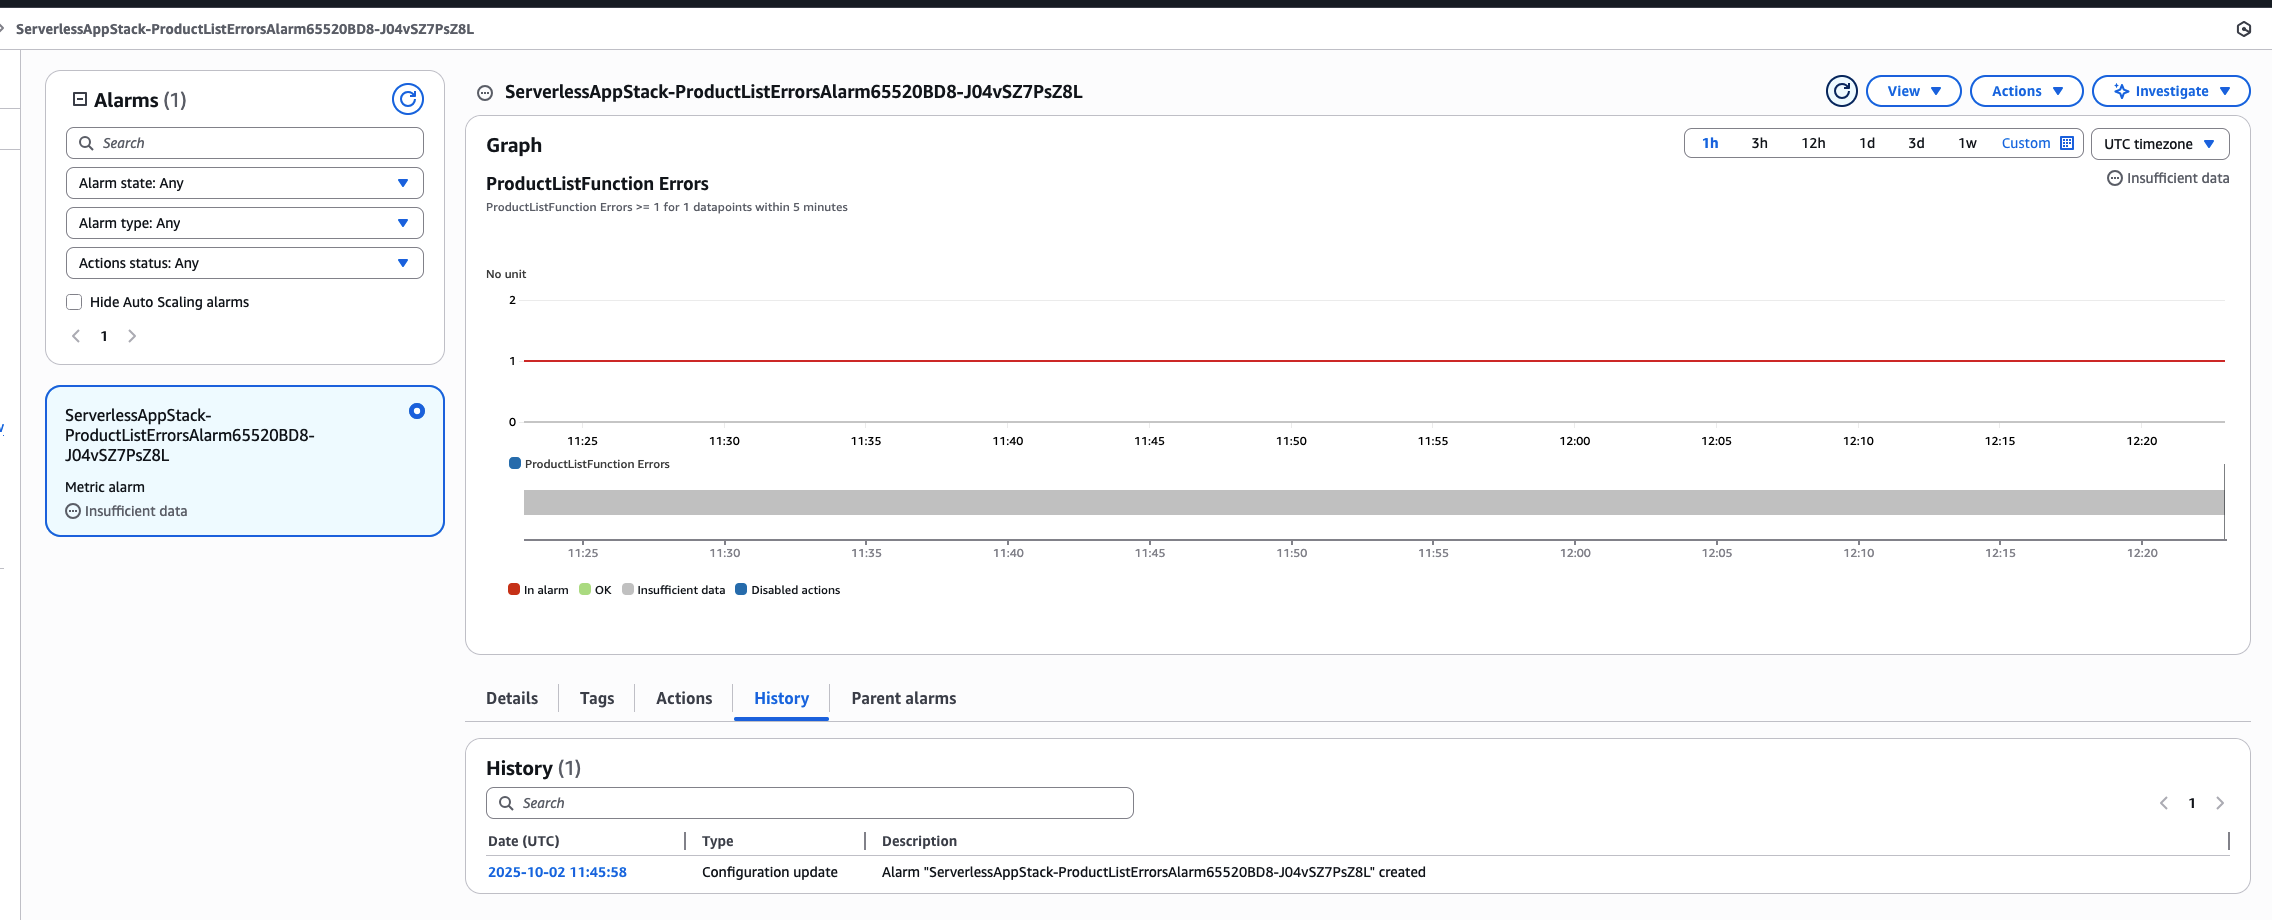
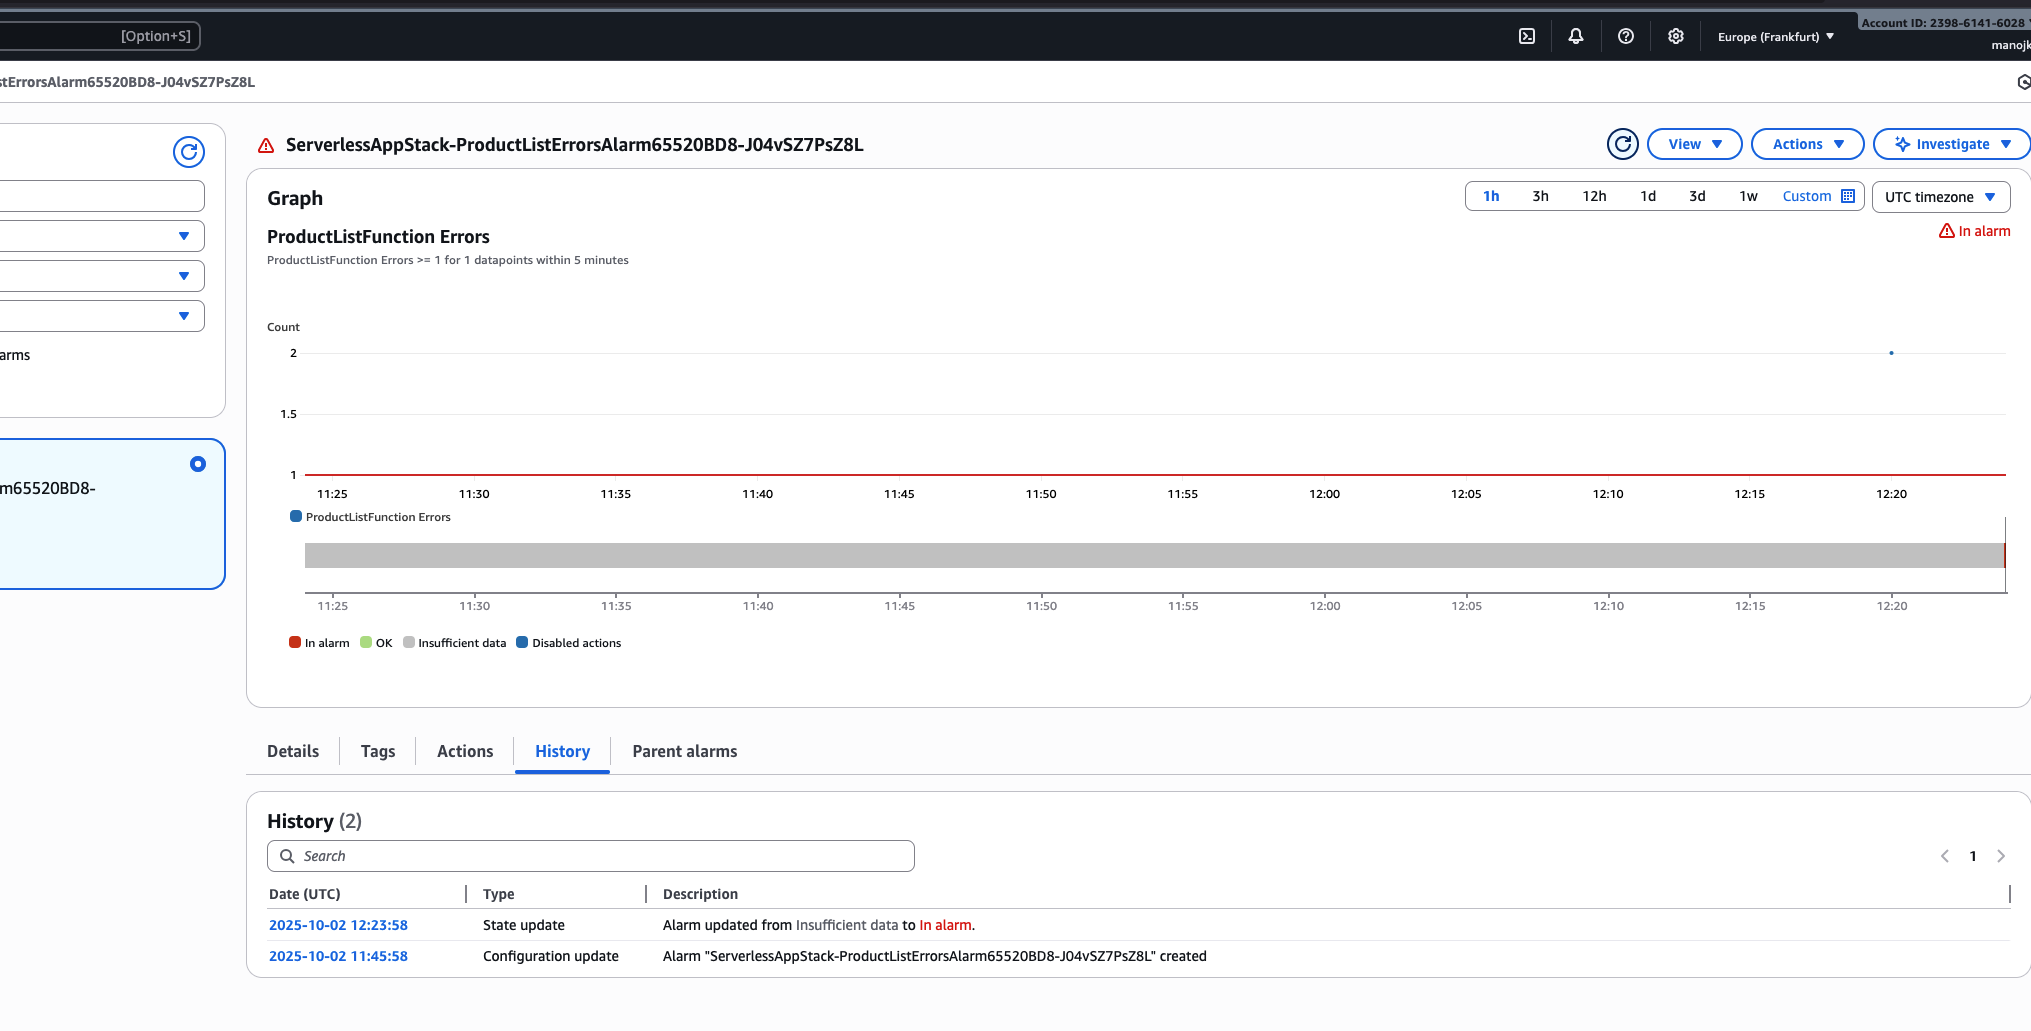
Within moments, the CloudWatch alarm detects the error. The alarm state transitions from "Insufficient data" to "In alarm" as the error data point appears above the threshold on the graph.
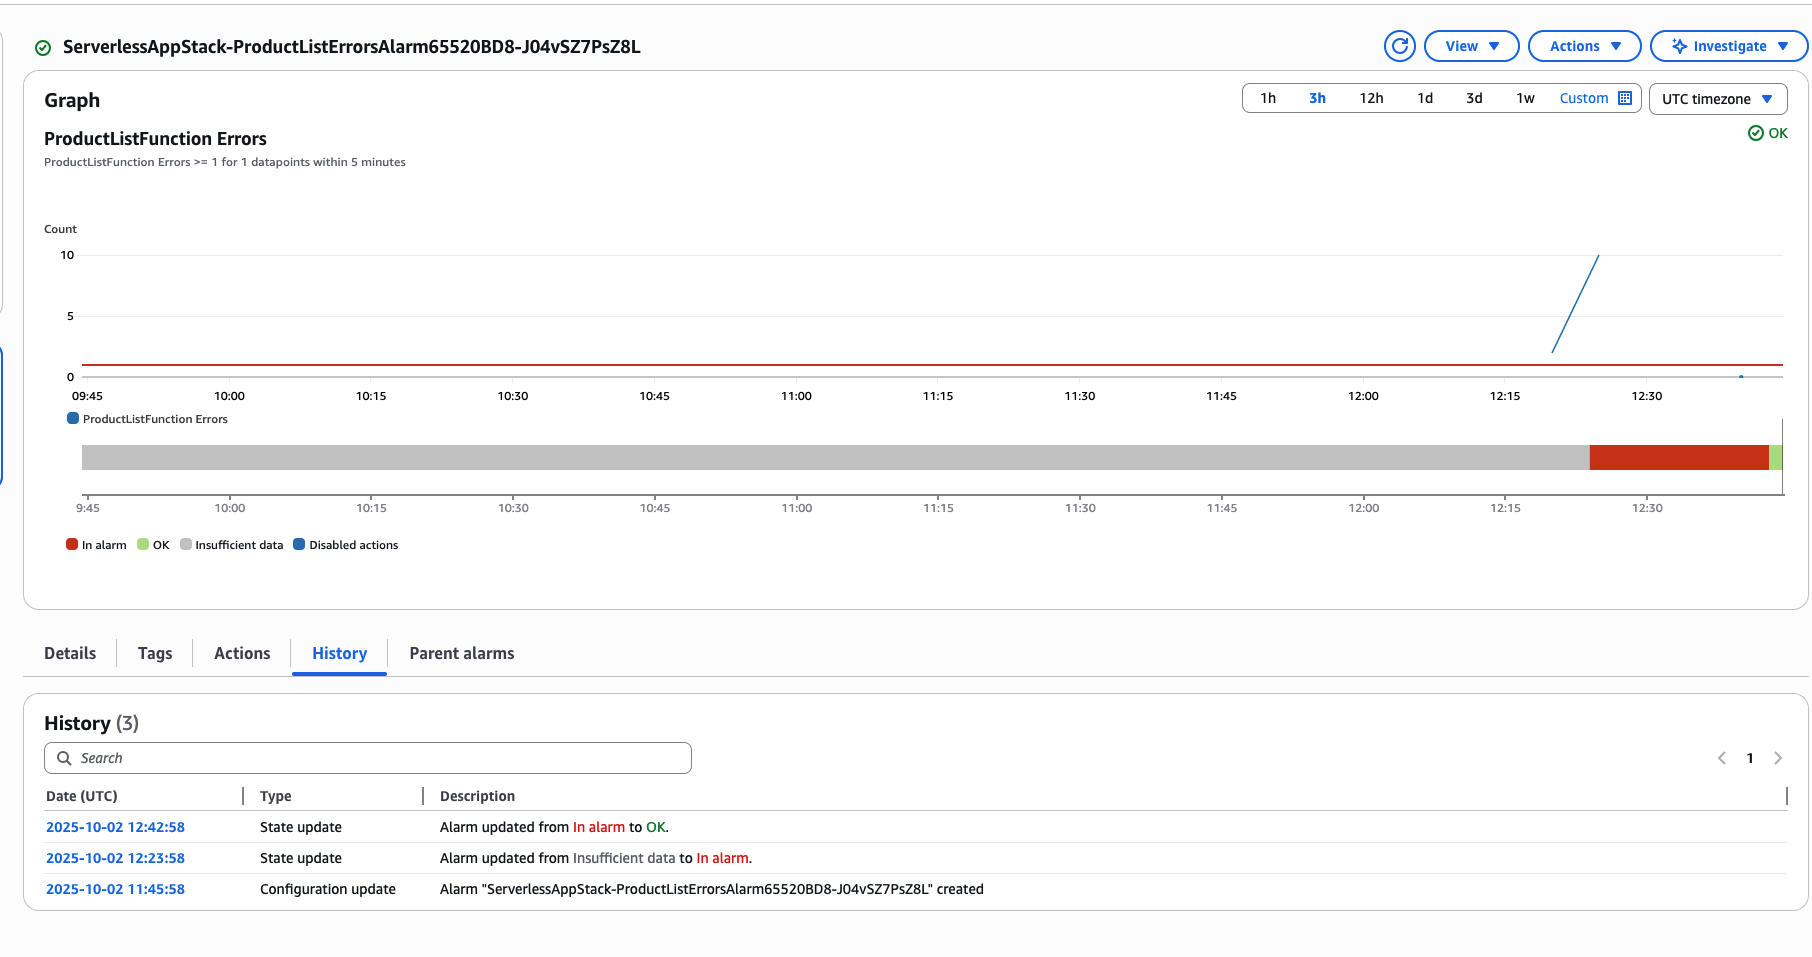
After re-enabling the permission and deploying the fix, the function works correctly again. The alarm automatically transitions back to "OK" state once the evaluation period passes without errors.
Key Takeaways
AWS CDK's L2 constructs transform what could be a complex CloudWatch configuration into just a few lines of readable code:
- Metric methods are built into resource constructs, so you don't need to look up metric names
- Enumeration classes prevent typos and make code more maintainable
- The create_alarm method eliminates boilerplate alarm configuration
- Sensible defaults mean you only specify what matters for your use case
Going Further
This example creates a basic alarm, but you can extend it further:
- Add SNS topic notifications to receive emails or SMS when alarms trigger
- Create dashboards combining multiple metrics
- Set up composite alarms that monitor multiple conditions
- Implement automated remediation using Lambda functions triggered by alarm state changes
Conclusion
Monitoring doesn't have to be complicated. AWS CDK's L2 constructs make it straightforward to add production-grade observability to your serverless applications. With just a few lines of code, you can ensure you're always aware when your Lambda functions encounter problems.